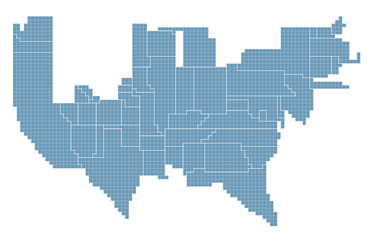
I study cartogram design. Cartograms are thematic maps in which the enumeration units (states, countries) are resized based on a particular attribute (population, carbon emissions). There are dozens of types/designs of cartogram and many methods/algorithms for cartogram production.
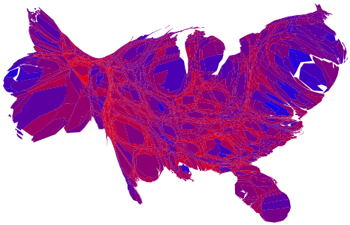
These have gotten a lot of attention lately (uses the Gastner-Newman diffusion-based algorithm).
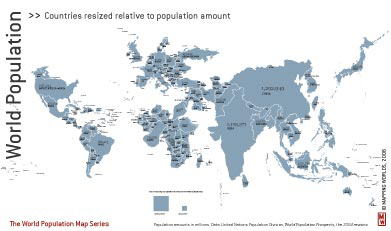
Some cartographers manually tweak their automatically generated cartograms to better preserve shape or topology (from the Dutch company Mapping Worlds).
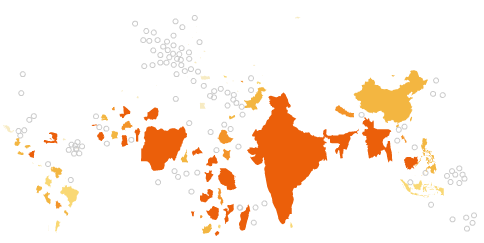
Some preserve shape completely (from the Online Atlas of the Millennium Development Goals also by Mapping Worlds).
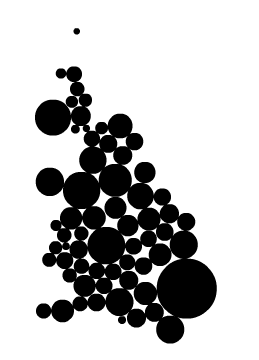
Others abstract enumeration units to geometric primitives (generated by my Python script, based on Daniel Dorling’s algorithm).
And of course many other designs can be found between these extremes (redrawn from the NY Times‘ 2006 election results app).
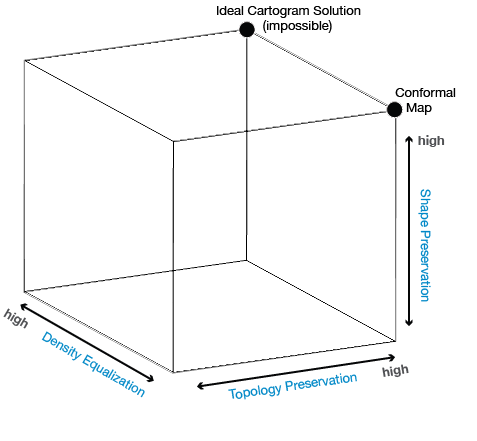
The standard approach to cartogram design is to classify them as either contiguous or noncontiguous (with some adding a pseudo-contiguous category). As the small gallery above illustrates, this is inadequate. It seems to me that cartogram designs vary along three dimensions, and that variation along each dimension is continuous.
- Shape preservation — how much the original shapes are preserved on the transformed cartogram (can be quantified with local angles and edge length ratios)
- Topology preservation — how well adjancencies are preserved
- Density equalization — how accurately unit size represents the chosen attribute
The latter requires perhaps more explanation. Isn’t size on a cartogram supposed to perfectly reflect the chosen attribute? Sure, but some recent cartogram algorithms (Gastner-Newman slightly, Kocmoud-House somewhat more) have chosen to allow for some inaccuracy in order to better preserve shape or topology. Since readers can’t accurately estimate area anyway, this seems like a fair tradeoff.
To show these continua, and better portray the tradeoffs involved in preserving individual properties, I drafted the Cartogram Cube. It has helped me think through some of these issues while writing my thesis.
Cartogram3
Does any of the above matter? Well, only to the extent that it helps us make better maps. But I believe cartogram effectiveness has a lot to do with these design characteristics, and depends largely on the property tradeoffs made in cartogram design (for manual and algorithmically-produced cartograms). Indeed, this is precisely what my thesis results — to be defended on May 13 — indicate.
More on my actual results later.
5 Comments
Hollywood,
I’m thinking through your Cartogram3 image and am not sure about the placement of “Geographic Map”. This could be a misinterpretation of what you mean by density equalization, but let me talk this out. To start, I assume that by geographic map you mean a projected 2-D map. I agree that nearly all projections preserve topology (excepting interrupted projections and the seam line of all world projections, usually at the international date line). I think that the basics of cartography argue against that fact that all geographic maps preserve shape - only conformally projected maps do. Similarly, equivalent geographic maps preserve density equalization (the chosen attribute for density equalization is physical area). This leads me to believe that placing “Geographic Map” in the top right corner is inappropriate, as only non-compromise conformal projections do this (maybe relabel with “Conformal Map”). Further, there is likely room to place “Equivalent Map”, “Interrupted Map”, and “Compromise Map” somewhere in the cube.
Sorry to be such a stickler and I know that the cube is more of a way to show differences between types of cartograms (which you did not show in this post, but I have seen previous drafts) rather than a way to contrast cartograms against regular maps. But if you are going to do this comparison, I think the problem is more complex than just locating a single “Geographic Map”.
hearthRob
P.S. No AAG posts about getting us kicked out of a restaurant?
Fair point — I meant a geographic map with a conformal projection there.
Interesting post.
Could you put points on your cube diagram showing where you think the 5 examples in this post lie along the 3 continua? For example, Gartner-Newman’s election map would be toward the back-right-middle?
Also, is your thesis done and available on the web?
I obtained in this article coming from The search engines. This kind of appears a great posting. As i comprehensively appreciated browsing your web blog, i could be likely to go back. That i stored yuor web blog i in addition passedyour can i a few close relatives in the process. I hope you don’t imagination!
I do accept as true with all of the concepts you have offered to your posting. They’re very effective and will certainly work. Still, typically the blog posts are actually very brief designed for novices. Could you i highly recommend you extend these individuals a little as a result of subsequent time period? Thanks to your write-up.
2 Trackbacks
[...] Johnson has a good post on this topic on his blog (cartograms are the focus of his Masters [...]
[...] Cartograms come in a few different flavors (see indiemaps summary): [...]