I like tag clouds. They look cool, and they work.
3d visualization cartography climate change geographic information science geographic visualization geovisualization gis giscience interactive map modeling self-organizing maps uncertainty visual analytics visualization
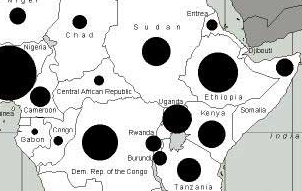
Tag clouds use the visual variable of size to convey information. As a cartographer, then, my first instinct was to compare tag clouds to proportional and graduated symbol maps.
When viewed in this light, tag cloud scaling begins to seem quite haphazard — font point sizes, not areas, are modified to communicate the data. Thus, two tags of varying character length (GIS vs. Geographic Information Science, for example) but equal incidence will have very different visual presence (though their font point size will be equalized, the area will not).
3d visualization cartography climate change geographic information science geographic visualization geovisualization gis giscience interactive map modeling self-organizing maps uncertainty visual analytics visualization
Sixteen hours into my 30 hour train trip from Boston South Station to Chicago Union Station, I got the hairbrained idea that tags could be more accurately scaled — each one can be thought of as a rectangle, and a point size can be calculated for each tag such that its rectangle’s area is proportional to its incidence.1 I call this the Amtrak method. I wrote first an as3 class, then a somewhat hacky PHP script to generate the pseudo area-scaled tag clouds. I say it’s hacky b/c the areas aren’t really exact — I don’t have a method for exactly figuring the bound area of rendered html text. So instead, I estimate it based on character length. Specifically, I estimate the area of a rendered tag to be:
tagarea = taglength * fontsize2 / 2
A simplification to be sure, but based on some tests in Flash, not too inaccurate (for my Helv anyway). This gives us the formula for the font size of each tag.
fontsize = sqrt( 2 * tagarea / taglength )
In the above, tagarea is determined by dividing the tag’s occurrence value by the maximum number of occurrences among all the tags and multiplying this percentage by a predetermined maxarea value (I use 12,000, natch). So for each tag:
tagarea = occ / maxocc * maxarea
This generates the following, based on the same data as the above two clouds.
3d visualization cartography climate change geographic information science geographic visualization geovisualization gis giscience interactive map modeling self-organizing maps uncertainty visual analytics visualization
Leave it to a grad student to create a problem where none exists. Looking at my new Amtrak tag clouds, I don’t think they communicate the data more clearly. As I say at the beginning, tag clouds work. Existing tag clouds work. And they work for a reason. Font point size is a measure of the height of the text, the distance “from the top of the capital letter to the bottom of the lowest descender, plus a small buffer space” (Ellen Lupton’s Thinking With Type).
Thus, tag clouds employ the specific size variable, height (or length). This is most similar to proportional symbol maps using a bar symbology.
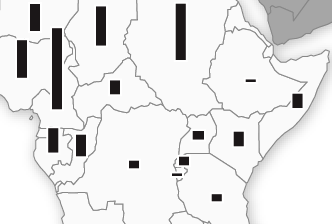
But it isn’t that simple. The symbols in a tag cloud also vary in width. The important data is encoded in height, the width is simply related to font size and tag character length, and it must be temporarily ignored by readers to determine the tag’s number of occurrences. This is most similar to a bivariate technique in cartography where the width and height of a bar are varied independently to show two different variables.
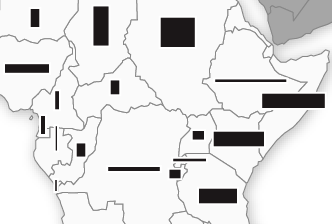
In such maps, as in tag clouds, the user is expected to attend to and separate the visual dimensions of width and height. Is attending to the height of a symbol, while ignoring its width, a realistic task? Or, in the speak of the discipline, is length a separable or an integral dimension? If it is separable, it can be attended to selectively. If it is integral, then it cannot be ignored.
There is no definitive answer to the question of size (or length) selectivity; existing evidence is mixed. Bertin considered size to be dissociative, or integral (in Semiology of Graphics). Alan MacEachren cites numerous studies of selectivity of visual variables (in How Maps Work) and my own thesis research has required a survey of the bivariate symbol literature. It appears that size-size has a configural relationship, which is somewhere between integral and separable (selectivity appears to be a continuum). Though not a sparkling recommendation, this at least suggests that people can, with little work, separate perceptually the width and height of a symbol. In doing so, they can estimate the number of occurrences of a tag, while ignoring the tag’s overall visual presence (esp. it’s width).
1 OK, I suppose another way of thinking about the area of the text is to look at the amount of ink on the page. But this would be much harder to determine, and will correlate with character length.
5 Comments
Allow me to inject some speculation and conjecture into this research-based topic. I think that with regard to separating width and height, we are perhaps dealing with a special case when we consider words. It’s a language issue. The width (i.e., length) of a word typically has little or no bearing on its meaning, and we know that the varying lengths of different words cannot imply any ordinal or numerical relationship between words. I wonder if we’re attuned to simply ignoring the length of words when looking at their “size,” allowing us to easily notice just height (or perhaps at least character size as opposed to word size).
I don’t recall the theory on this, but personally I find area comparisons easy only when the symbol doesn’t vary in its dimensions, such as a circle or square. Otherwise, it’s actually easier to compare each dimension individually while ignoring the other. Encoding a single variable in the area of a word is a problem because it gives both dimensions a partially arbitrary basis: the width is arbitrary to begin with, and the height becomes necessarily based on the width.
Wow. That’s pretty smart.
@Andy “The width (i.e., length) of a word typically has little or no bearing on its meaning”
Do you mean to tell me those five-dollar, polysyllabics I’ve been throwing around aren’t any different from regular old words? I call BS.
This is a terrific topic. I would have to conclude this problem calls for some kind of….um….what do you call those things….Oh yes!…cartogram. However, difficulty would arise in adjusting the white space between characters insofar as-as you mention-that space is as important as the ink, if not more so.
The box solution is interesting but in the output it’s already clear to me that “GIS,” despite it’s character length, is the most important.
I conclude tag clouds work because of magic.
Maybe this is something for on my own websites.
Prepare yourself for that opinion: Nothing else compares to.