The great Buckminster Fuller created a series of Dymaxion maps utilizing various forms of his patented Fuller projection in the 1940s and 50s. The most well-known, icosahedral form of the projection (above) was devised in Raleigh, North Carolina, in 1954. Fuller intended the projection to better balance shape and areal distortion, while also eschewing the north-south cultural bias he saw in common projections.
I’ve seen a few code implementations of Bucky’s design over the years, including the Perl scripts Schuyler Erle wrote for his touchstone Mapping Hacks. Erle’s modules were based on Robert Gray’s foundational work in determining the appropriate transformation equations which were then incorporated into C source code. But I hadn’t seen a client-side implementation until I saw this map in the examples section of Jeff Heer and Mike Bostock’s excellent JavaScript visualization framework Protovis. In this post I just show how their JavaScript Dymaxion code can be brought into OpenLayers as a custom projection.
Since Buckminster Fuller, Robert Gray, and Mike Bostock have already done all the hard work, adding the projection to OpenLayers is a cinch. But I think it’s worth showing here because there isn’t much info out there on using custom (that is, outside of PROJ.4) projections in OpenLayers. And I’d love to see more online slippy maps using such experimental projections.
OpenLayers implementation
Most web mapping frameworks only display data in the Web Mercator projection. This is basically because of a decision Google made six or seven years ago and because web mapping platforms have been used more for reference than thematic mapping. OpenLayers is unique in allowing coordinate system transforms from any arbitrary projection to any other. Of course, if you’re loading in Google or Bing tiles, you’ll have to stick to Web Mercator for any overlays; in this case OpenLayers will just be transforming your overlay data from lat/long to Mercator for display. But if you’re using all vector data — from KML, GeoJSON, or many other formats — you can take advantage of OpenLayers’ projection abilities. And this is almost always going to involve the Proj4js library, a port of PROJ.4.
Bjørn Sandvik provides a great introduction to projecting KML data with OpenLayers and Proj4js. Proj4js contains most of your old favorites, like Lambert and Albers and Transverse Mercator. But for custom projections like Dymaxion, OpenLayers includes the OpenLayers.Projection.addTransform method, which I’m using like so:
function( point )
{
var converted = convert_s_t_p( point.x, point.y );
point.x = converted.x * 150;
point.y = converted.y * 150;
return point;
}
);
EPSG:4326 in the above method represents the standard WGS 84 lat/long coordinate system. “DYMAX” is an arbitrary string that we’ll use whenever we want to apply the Dymaxion transformation. The convert_s_t_p method is from the dymax.js code included with Protovis and does all the heavy lifting of converting lat/long points to Fuller x-y coordinates. Notice I’m only defining the forward transformation — from lat/long to Fuller. The inverse would be quite difficult but is luckily not necessary for projecting geodata onto a Dymaxion map.
To utilize the defined projection, then, we just have to instantiate an OpenLayers.Projection object with our “DYMAX” projection identifier, and include this as an option when we create our OpenLayers map.
projection : new OpenLayers.Projection( "DYMAX" ),
maxExtent : new OpenLayers.Bounds( 0, 0, 860, 400 ),
allOverlays : true
} );
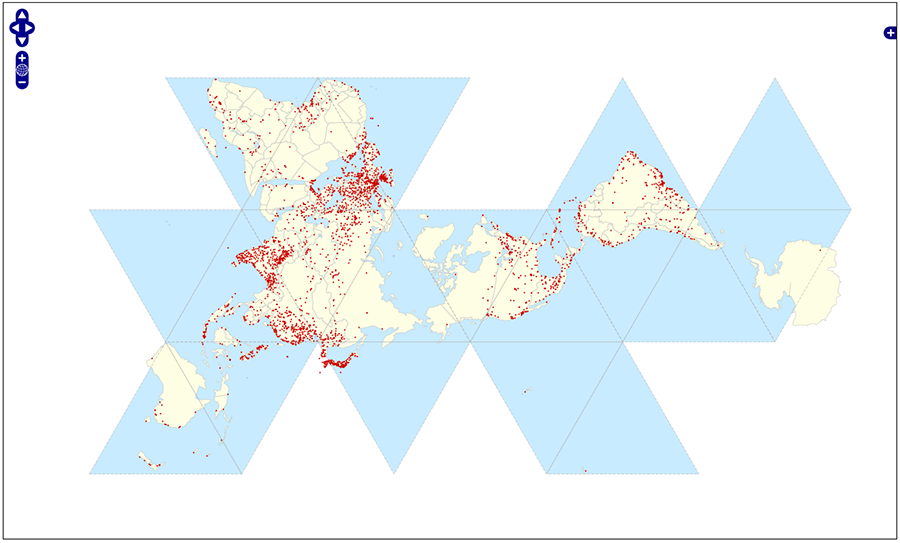
Below’s an image linking to an example of the Protovis Dymaxion code being used within OpenLayers. View source on that page to see the very little code that’s driving the example. The triangles and world countries should load right away in the Fuller projection, but the 3000+ world cities may take a bit.
Next
I’d be remiss if I didn’t mention Mike Migurski’s remarkable work on the “Faumaxion” projection, which resulted in an experimental and path-breaking interactive browser that re-orients and re-configures its equilateral triangular coordinate system based on the map center and scale. Ideally something similar would be possible using OpenLayers and the icosahedral geometry of the Dymaxion projection. But that’s way ahead of me and this post. Please see Mr. Migurski’s posts (I, II, III, and IV) for more information on the Dymaxion transformation and Migurski’s reasons for switching to a gnomonic projection thanks in part to its extant and efficient inverse equation.
I just want to see more and more geographic projections available in web mapping frameworks. An argument can certainly be made that no more than a handful of projections are necessary for the vast majority of reference and thematic mapping purposes. But this leaves out certain artistic and political mapping pursuits that may benefit from more experimental projections like the Dymaxion.
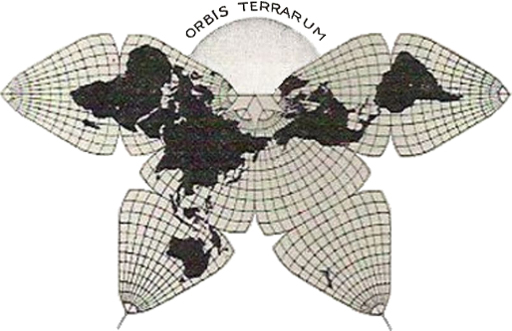
Gene Keyes, a Fuller devotee, has declared a similar but earlier octahedral projection (below) by B.J.S. Cahill superior to Fuller’s (h.t. the Map Room). So next I’d like to see about implementing Cahill’s also-patented “butterfly” projection for vector data in JavaScript. Both Fuller and Cahill are in a class of interrupted projections that are 1) especially difficult to implement for vector data because of section crossings and 2) potentially quite useful for mapping global datasets due to minimized shape/area distortion and the horizontalization of the classic world map projection’s north-south orientation.
Much love to the Buckminster Fuller Institute, the current patent-holders of Fuller’s geographic transformations. And again full credit must go to the Protovis people for their client-side implementation of the Dymaxion/Fuller projection algorithm.
7 Comments
Totally awesome work! Agreed that we can do so much more with useful projections.
Do you think it would be much of a challenge to have WMS / Tiles in these projections?
@Tim: Hey thanks!- but most credit should go to the Protovis people. I think implementing this in a tileset would be difficult because the reverse projection formula would be required to get all the tile math right. But I’m not really sure. Something like M. Migurski’s great work with the Faumaxion projection (a raster implementation) would probably be more applicable. But I’d love to see it!
Hi there, great work combining all these elements and writing the article.
I’m a little bit confused by the implementation though.
If you remove the triangular layers, the map defaults to EPSG:4326 without a “displayProjection” attribute of “DYMAX”.
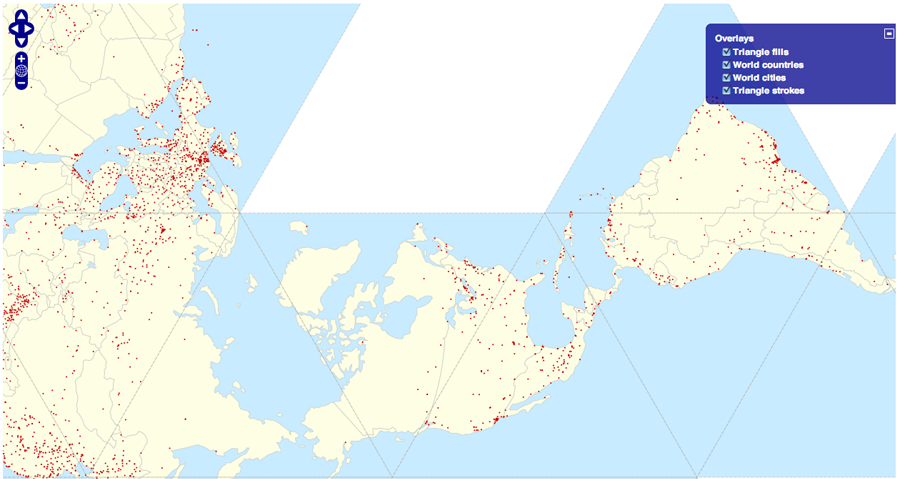
As the data set works in EPSG:4326 mode, and in dymax, I wonder how this is accomplished? If I load another EPSG:4326 kml file into another layer and set it to dymax, anytime my vectors or lines cross a triangular boundary, they jump to the new triangle, leaving a mess of lines. (Note in the example shown, Australia and Antarctica do not do this.)
It can also be illustrated by creating a new vector layer and adding small lines to represent long and lat lines. These again result in a jumbled mess. I wrote an algorithm to check (if I was drawing the lines myself) and prevent lines that cross (non adjacent) triangles from drawing at all.
However, this is impossible if you import a kml resource, but yet it works for the linked kml of world countries.
Any ideas?
To answer my own question - the dymax conversion routine does not convert from long-lat to the specified triangle background, but has some triangles split to accomodate landmasses.
My companion Mary Jo Graça has done a very detailed program in Perl and OpenOffice.org-Draw for a vector rendering of both a one-degree graticule and a 1/1 million coastline for the Cahill-Keyes octahedral world map. Complete description, diagrams, and programs, here: http://www.genekeyes.com/CKOG-OOo/1-CKOG-principles.html and http://www.genekeyes.com/CKOG-OOo/7-CKOG-illus-&-coastline.html and
http://www.genekeyes.com/MEGAMAP-BETA-1/Megamap-Beta-1.html
I have a “draft” implementation of Cahill-Keyes in javascript for d3.js in http://bl.ocks.org/4266794
(I am just trying to find out whether d3 can in fact support “interrupted” map projection…see the artifacts in the gist above…)
Wow, it looks really different this way!
2 Trackbacks
[...] difficult to produce, the code for producing such a projection in a web map is available. Using the OpenLayers JavaScript API and some custom JavaScript from Protovis, Zachary Johnson was [...]
[...] Factbook (2013), Indie Maps, the Wikipedia (2013) for most megadeath events, various posts of mine: At least 100 [...]