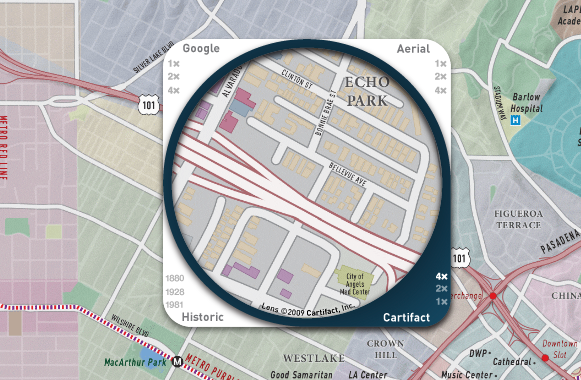
L.A.’s Cartifact recently released Cartifact Maps, a Flash-based tilemaps viewer with custom cartography and advanced map browsing tools. The historic overlays and beautiful cartographic design are perhaps of most interest, but I’m equally impressed by their implementation of a novel map browsing UI featuring a magnifying glass or “lens tool”.
I first saw this map browsing technique in a minimal browser Matt Bloch created for an older static project.
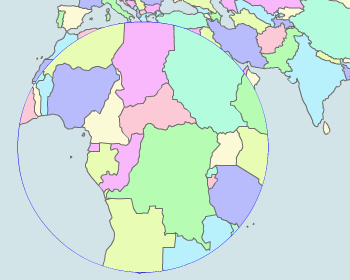
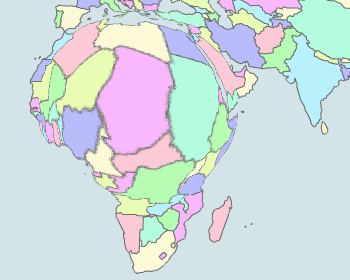
I implemented a lens tool in the final project version of the World Freedom Atlas. I also experimented in some of the early prototypes with a continuous fisheye effect for map browsing. The latter never really took off because of the distortion and pixelation inherent in the raster method.
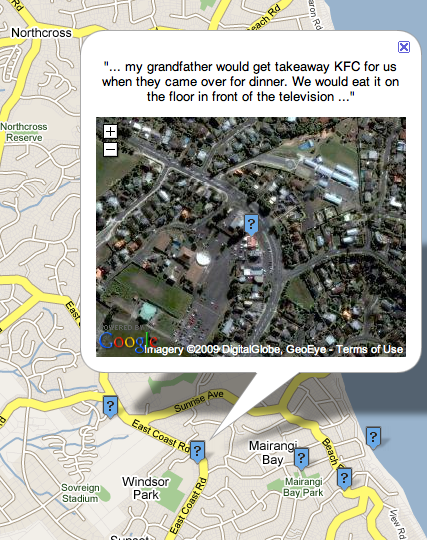
And the same idea in a Google Maps mashup.
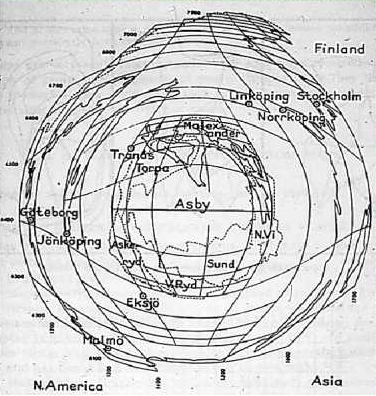
The originator of the fisheye/magnification method for multi-scale mapping is probably Edgar Kant, in a 1957 map he produced for a migration study of Asby, Sweden, by Torsten Hägerstrand. Here the “distance from the centre shrinks proportionally to the logarithm of the real distance.”
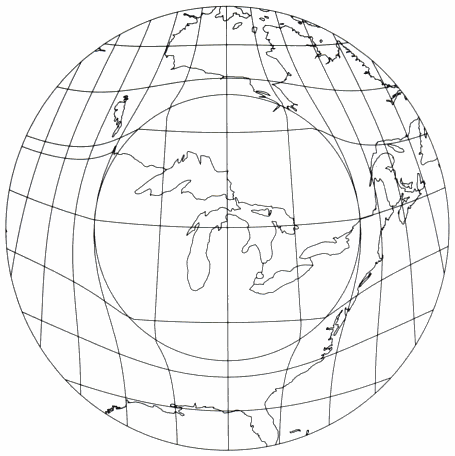
Much work proceeded on multi-scale map projections, with the touchstone article being Snyder’s 1987 “‘Magnifying-glass’ azimuthal map projections”. Good coverage on such projections (including parallels to cartogram distortion) can be found in Canter’s Small-scale Map Projection Design.
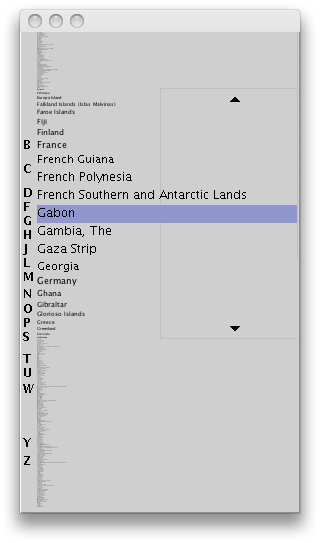
In non-mapping UIs, the magnification/fisheye effect is fairly common; the Mac dock does it and even Cover Flow can be considered somewhat of a variant. For browsing and selection from a “large linear list”, Ben Bederson at HCIL came up with fisheye menus.
So nothing new in general UI terms, but still pretty novel and perhaps especially applicable to online map browsing.
Map browsing
Axis Maps cartographer Andy Woodruff did a great post on a variety of map panning and zooming methods. The lens or magnifying glass tool performs both panning and zooming functions, and should be considered as an alternative to the nine methods outlined there.
In interactive applications, the approach’s major strengths are threefold:
- low mouse mileage for panning and making selections
- less disorientation or “getting lost” as general cues are always available
- the ability to see generals and specifics simultaneously
The last is particularly important in cartographic applications where the success of a good thematic map is often seen as its ability to present overall trends and specific values in the same map.
Semantic zoom lens tool
The Cartifact example above is particularly interesting because of the semantic zoom inherent in its lens tool. In normal, geometric zooming, a map (or other image) is simply blown up; more detail is shown by definition, because more pixels are dedicated to the image. In semantic zooming, different (typically more detailed) larger-scale renderings are shown at higher zoom levels; not only are features larger, but more details (and labels) are shown. Such semantic zooming is standard in slippy maps, which are produced and tiled at predefined zoom levels. Nonetheless, the application to a lens tool is noteworthy, especially in thematic cartography; generals and specifics can be presented simultaneously, and both can be tailored semantically to different zoom levels.
Here’s a quick example I threw together in Flex using Modest Maps (right-click to view source).
I like inverting the above, or perhaps more interestingly, showing Microsoft Aerial as the base and Microsoft Hybrid as the lens; the spotlight (zoomed in or otherwise) then serves to provide political/cultural details for the moused-over region.
Application to thematic cartography
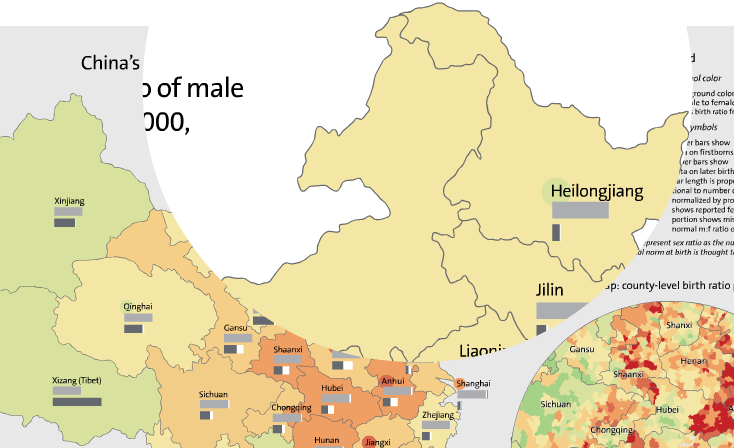
In online thematic cartography, the practice of showing smaller enumeration units at higher zoom levels is somewhat common. The NY Times has done it a few times, including their Election 2008 results maps (the county-level choropleth is revealed by zooming in).
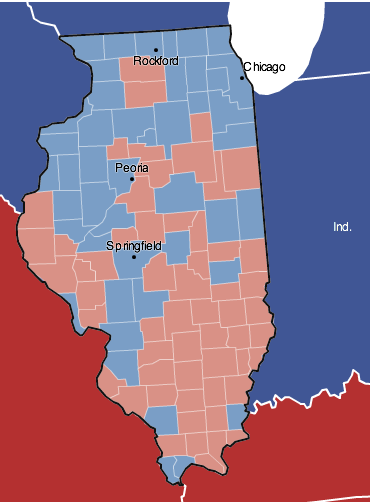
The same idea can be applied to a lens tool. Here the lens reveals the county vote results, and can be zoomed (again, a quick Flex job) to further investigate the local-level results. Click to launch the map (it’ll take a few secs to load, project, and draw the data).
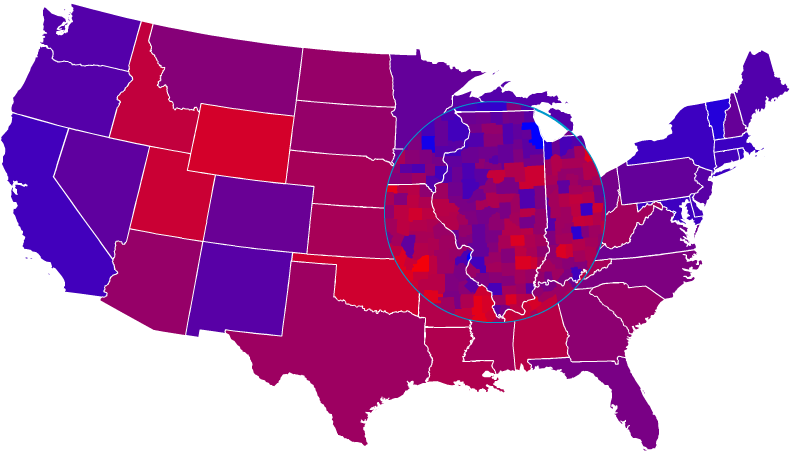
The above is based on some projections and choropleth code I released last year. I think there’s more room for experimentation here: the size of the lens could be user-modifiable and semi-transparent (so you can still see where you’re mousing over the main map); I’d also like to create a less-pixellated fisheye lens and try out multiple lenses/fisheyes (for detailed comparisons of multiple areas while still providing context).
8 Comments
Don’t forget about SFMOMA ArtScope! The idea for the loupe in that project came out of a Modest Maps experiment much like yours. The Cartifact one is really slick, though, and makes me wish that I’d taken that initial prototype a couple of steps further.
I would be interested to see how a modifiable lens size and semi-transparency turn out. Although the lens tool does allow you to zoom in and see detail without getting completely lost because the rest of the map is still visible around it, if the lens is zoomed I do start having trouble maintaining a more local context because of the now hidden ring between what’s inside the lens and what’s outside the lens. Transparency as a solution to that could easily be confusing but could possibly be pulled off. Right now, in your examples what I’m digging most is using the lens to reveal more detail without any zooming, which alone is a fantastic use of the lens tool, without any risk of the “navigational trauma” that Drs. Harrower and Sheesley were concerned with in their discussion of panning and zooming methods.
There’s also Idelix PDT:
http://www.idelix.com/handheld.shtml
Fits in nicely with a lot of other non-euclidean visual representations that I talk about here: http://digitalcomposting.wordpress.com/2008/08/08/non-euclidean-user-interfaces-2/
Great article.
Very well written and extensive analysis of the zoom as an interaction design pattern.
Don’t forget about <a href=”http://www.sfmoma.org/projects/artscope/index.html” rel=”nofollow”>SFMOMA ArtScope</a>! The idea for the loupe in that project came out of a Modest Maps experiment much like yours. The Cartifact one is really slick, though, and makes me wish that I’d taken that initial prototype a couple of steps further.
Thanks, good article.
What’s up to all, how is everything, I think every one is getting more
from this web page, and your views are good in favor of new users.
3 Trackbacks
[...] indiemaps.com/blog » Lens tools and fisheye map browsing [...]
[...] details of the latest insert from National Geographic magazine. So I enoyed the post called “Lens Tools and Fisheye Map Browsing” by cartographer Zachary Forest Johnson (via O’Reilly Radar). [...]
[...] indiemaps.com/blog » Lens tools and fisheye map browsing (tags: maps visualization) [...]