Part 2 of what will now be an ongoing series about my work with the Dorling circular cartogram algorithm; see part 1
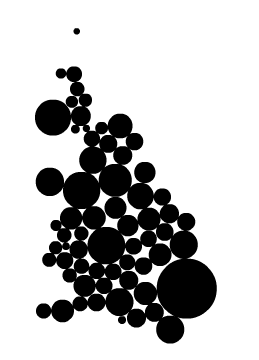
Above (top) you see the current results of my reworking of the brilliant circular cartogram algorithm by Dr. Daniel Dorling (image on the bottom is from my Python port of Dr. Dorling’s original algorithm, using his original input format). So far it’s looking pretty poor; but you should have seen it a week ago.
Now, there’s nothing wrong with the algorithm created by Dr. Dorling, as published as C code in Area Cartograms (1996) or as Pascal code in a 1995 article in Environment and Planning. But the algorithm requires as input something that doesn’t really exist for most geographies — that is, something that needs to be generated. Specifically, the algorithm requires a text file of the following format:
Feature_number Value(any variable) x-center y-center number_of_neighbors [neighbor_number common_boundary_length]…(repeated)
Apparently, in the 1980s, Arc used a topological data model (.aat files), which made generating the above file easier (though Prof. Dorling suggests that some manual changes were still necessary). The currently popular, Arc standard, shapefile is a non-topological data model, meaning that each feature (a country, say) is stored independently of all others — shared borders are in no way encoded. Detecting them would be very computationally intensive, and would likely require some type of spatial hashing, even using a language such as C++. But it has been done (see mapshaper.org).
So I was willing to begin writing a script to detect and store the length of shared borders, using only a shapefile as its input. But then a much simpler method occurred to me. You see, shared border length is just one way of representing topology and of determining what neighbors an individual feature has. Another way, seemingly, was to simply use inverse distance between centroids. Centroids could be calculated for each feature, and if two centroids are within a certain threshold, the features could be considered neighbors.
Though the code and pseudo-code for the algorithm are published in Area Cartograms, it really hinges on two forces: repulsion and attraction between bodies. Repulsion is based simply on overlap of circles. Attraction was initially based on shared border length, but seemingly could be modified to work with inverse distance between centroids.
As is obvious from the images above, the modification was not perfect — inverse distance could not simply stand in for shared border length. But I have many ideas for fixing this, and will get into these in a future post. And fantastically, Dr. Jim Burt has agreed to supervise an independent study on this, so that I can actually gain school credit for my obsession. More soon!
2 Comments
I was hoping you might be able to answer a quick question. How is the radius of the circle calculated? I found a copy of the 1996 book and the 1995 article, but it doesn’t go into much detail. For those interested in the book, the Quantitative Research Methods Group of the RGS has the entire CATMOG series as pdfs. http://www.qmrg.org.uk/?page_id=141 including Dorling’s. It also available here: http://www.sasi.group.shef.ac.uk/publications/1996/dorling_area_cartograms.pdf
Good blog post. Things i would like to add is that computer system memory ought to be purchased but if your computer can no longer cope with anything you do with it. One can put in two good old ram boards having 1GB each, for example, but not certainly one of 1GB and one with 2GB. One should look for the car maker’s documentation for own PC to be sure what type of memory space is necessary.
4 Trackbacks
[...] MAPresso produces a variety of thematic maps, including two cartogram designs: the semi-contiguous circular cartogram and the contiguous rubber sheet method of Dougenik, Chrisman, and Niemeyer [...]
[...] recent work on creating a more flexible circular cartogram algorithm meant that I needed (well, wanted) to load [...]
[...] (see county.in). I’ve done some more experiments with the circular cartogram algorithm: here, here, and most recently [...]
[...] Dr. Dorling made Pascal and C code available. I ported it to Python, and began experimenting, mostly in vain, on a method that worked with a shapefile as input, but without the expense of building topology. [...]