update: Here’s the dorling.py code, which is just a port of Danny Dorling’s C to Python. Remember, this only works with a particular topological input format (see county.in). I’ve done some more experiments with the circular cartogram algorithm: here, here, and most recently here.
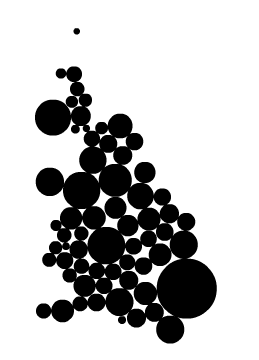
Dr. Daniel Dorling was recently nice enough to provide me with some C sourcecode for producing his circular cartograms. And it works great! I’ve already ported it to Python and have consumed the result in Flash. Below is a screenshot of a circular cartogram of British population by county. That’s after 300 iterations of the algorithm, which took about 2 seconds.
Next step: getting the program to consume shapefiles/DBFs rather than its current proprietary format. This will work its way into something. Stay tuned!
2 Comments
This is an excellent example and I’d like to try to implement it for my data set. However, I’m having a hard time figuring everything out without the header file of your input file. Do you have that, or have you ever updated this script as you suggested you might? Thanks in advance.
Hi,
I’ve just been trying out your program. (a struggle at first as I’ve no experience of using Python outside the ArcGIS environment).
However, I’ve managed to create an output file called ‘county.out’ using the data file you provided ‘county2.in’
What should I do with this file at this stage?
4 Trackbacks
[...] talked about this before: Parts I & [...]
[...] Part 2 of what will now be an ongoing series about my work with the Dorling circular cartogram algorithm; see part 1 [...]
[...] with many other gems of quantitative geography). Dr. Dorling made Pascal and C code available. I ported it to Python, and began experimenting, mostly in vain, on a method that worked with a shapefile as input, but [...]
[...] addition to knowing the neighbors of all features, Daniel Dorling’s original algorithm requires as input the shared border lengths of all contiguous features. These are used in the [...]