More props to the EveryBlock team. While checking out my old neighborhood in Chicago, I noticed that they’ve changed the way they symbolize happenings. The following three images were captured as I drilled down on some happenings in Lincoln Square (restaurant reviews, aggravated assaults, etc.).
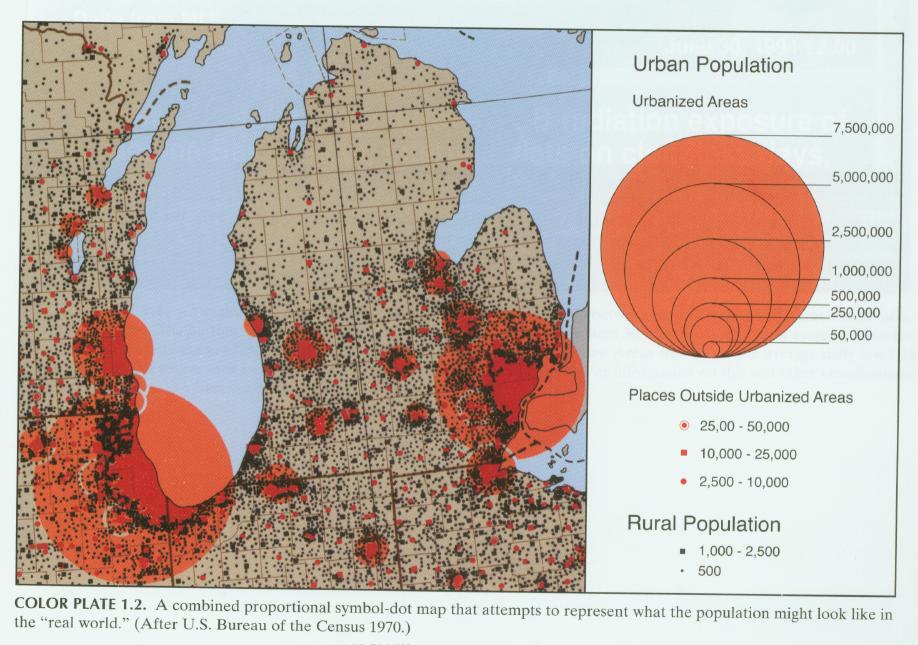
Notice how the news items are aggregated into proportional symbols at the smaller scale, while you receive more specific locational information if you zoom into them. A related technique is common in static mapping, especially of population. Dot density is used to show population in lower-density areas, while proportional symbols are used in cities.
Before now, though, I hadn’t seen a good interactive example of this scale-dependent symbolization (semantic symbolization?).