I’m kind of on a cartogram kick lately. I’m interested in the pioneers of the form, those who first thought to distort borders and explode topologies in order to convey the distribution of some thematic variable. When was the first cartogram produced, where, and by whom? I ran into a lot of material while researching my thesis; this post only begins the discussion.
1868
The honor typically goes to Émile Levasseur for the diagrammatic maps contained in his 1868 and 1875 economic geography textbooks.
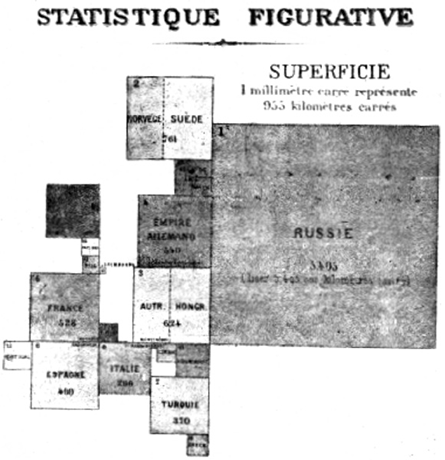
H. Gray Funkhouser (1937) wrote of these “colored bar graphs”,
squares proportional to the extent of surfaces, population, budget, commerce, merchant marine of the countries of Europe, the squares being grouped about each other in such a manner as to correspond to their geographical position
Interestingly, Waldo Tobler (2004) points out that the example printed by Funkhouser (above) was sized by land area and thus not a true value-by-area cartogram. I don’t have access to Levasseur’s texts, and it’s odd that the only available scan of Levasseur’s first cartogram shows a diagrammatic map, not a true cartogram.
1897
On the other hand is the image below, whose units are definitely sized to the data, but whose geographic arrangement is questionable. I first saw this page from an 1897 Rand McNally Atlas of the World in a SpatialCollective post; a high res version is available from the David Rumsey Map Collection.
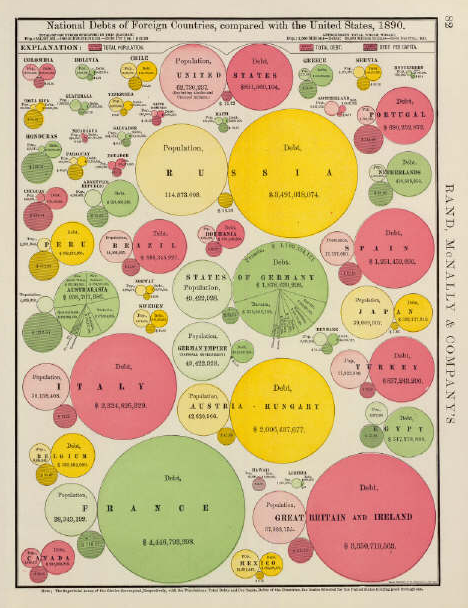
Circles on the left are sized proportional to population, those on the right to debt. Though the arrangement seems haphazard, geography is not ignored as the circles are grouped together by continent. I don’t really buy these as cartograms, but they’re certainly a predecessor to the circular cartogram form popularized by Danny Dorling nearly 100 years later.
1903
Others refer to the election maps of Hermann Haack and Hans Wiechel as the first cartograms (presumably because the popular example of Levasseur’s earlier technique was scaled by land area). These cartograms, which show election results in the Reichstag, were sized to population and of the same rectangular form as the earlier Levasseur diagrams.
Though these maps are mentioned in the second volume of Eckert’s touchstone history of cartography, Die Kartenwissenschaft (1925), they’re not reprinted there, and I’ve no access to the original sources.
1911
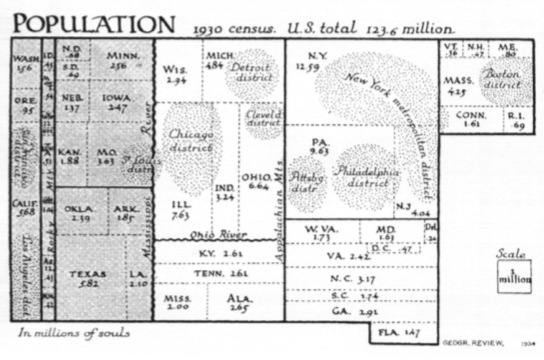
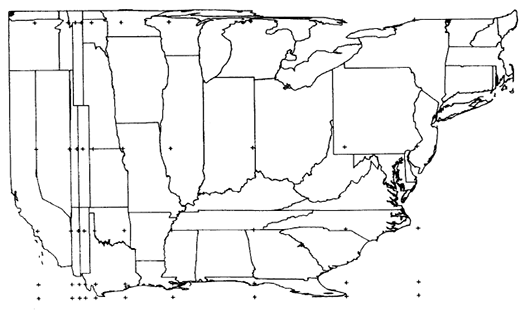
Professor John Krygier dug this one up — perhaps the first American cartogram, and an interesting example of the form.
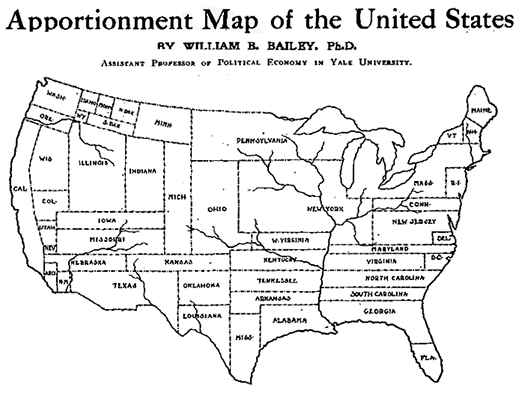
This is the earliest non-rectangular cartogram I’ve seen of any provenance, and it is unique in maintaining the exact outer shape of the United States, while abandoning unit shape and position.
1929
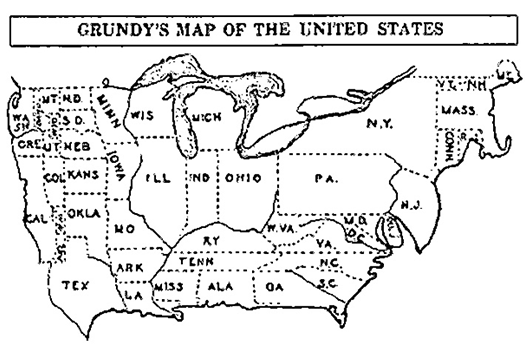
Another early American example, the above map by Joseph Grundy was published by the Washington Post in 1929. States are scaled “on the basis of population and Federal taxes”. Though somewhat rough, I consider this the first modern cartogram, as it maintains topology without abstracting to rectangles.
1934
Erwin Raisz was the first to give cartograms academic attention, describing their production in “The rectangular statistical cartogram” (1934) and devoting significant coverage to the form in his popular cartography textbooks.
1961
A later example, but still a first. In 1961, Waldo Tobler arrived at the University of Michigan as an assistant professor and began working on the first computer programs for cartogram production. His “pseudo cartograms” were created by expanding or compressing the lat/long grid until the minimum root mean squared error of unit densities resulted.
Errors were typically quite high, though likely no higher than those on the manually-produced ones that came before. All subsequent cartogram algorithms can be considered variants of Tobler’s method.
3 Comments
Interesting. Thanks for posting what you learned. It would be great if somebody came forth with examples of diagrammatic maps by Levasseur that *are* true value-by-area cartograms.
Your own Wager guess will get almost nothing, nonetheless it could lose when you live in.
Your players may have interactive communication together with stay sellers in
real world black diamond casino companies.
Very good information
4 Trackbacks
[...] de viejos cartogramas, gracias al siempre interesante blog de Zachary Forest [...]
[...] Excerpted from IndieMaps. Originally published there Dec. 8, 2009. [...]
[...] written about this before, so below’s a quick [...]
[...] Raisz, 1934.The distinction of the first cartogram has been attributed to Émile Levasseur who produced cartograms for his 1868 and 1875 economic geography texts.Non-contiguous CartogramsCartograms that focus on the distortion of area by a specific value can [...]