Below’s a quick outline of the first maps created with six common cartographic symbologies. All of the below is out there, in books, articles, and blog posts. Particularly helpful are Alan MacEachren’s 1979 article The Evolution of Thematic Cartography, Arthur Robinson’s Early Thematic Mapping in the History of Cartography (1982), Borden Dent’s thematic cartography textbook, and Michael Friendly and Daniel J. Denis’ Milestones chronology. I couldn’t find a good modern summary, though, of these “firsts” of thematic cartography. So I put a quick one together.
The six symbologies are the classic thematic cartography representation methods: choropleth, proportional symbol, dot density, flow, isarithmic, and cartogram. Borden Dent’s great cartography textbook, in the section titled “Techniques of Quantitative Thematic Mapping”, dedicates a chapter to each of these symbologies, and to no others. The classic Robinson textbook, as well as the modern Slocum et al one, also dedicate more space to these six representation methods than to any others.
isoline
The first isarithmic (representation of continuous phenomena using lines of equal value) map is often ascribed to Edwin Halley, with his 1701 isogonic contour maps of magnetic declination.
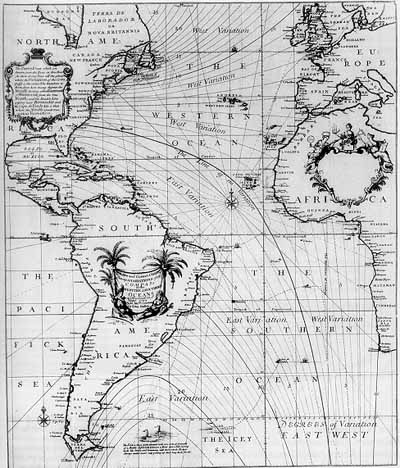
Not so, as the symbology has been traced back to as early as 1584. Robinson notes in Early Thematic Mapping:
The contour had tentative beginnings as early as the end of the sixteenth centruly in the form of lines of equal depth on a map of the River Spaarne made in 1584 by the Dutch surveyor Pieter Bruinsz. The next use of the symbol came more than a hundred years later in 1697 by Pierre Ancellin…
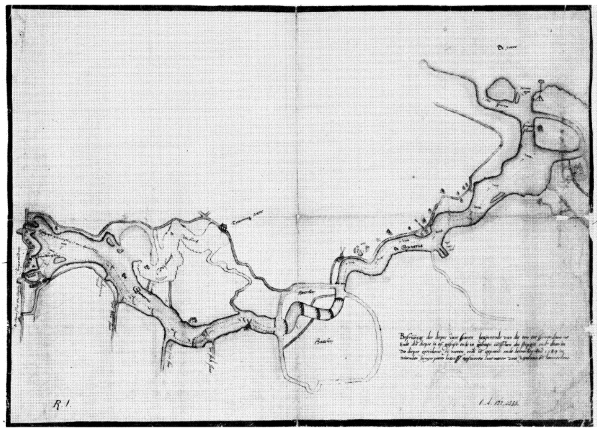
You can’t see too much in the above — a terrible scan I made from Robinson’s Early Thematic Mapping. This map isn’t listed on Milestones, nor could I find any reproductions of Bruinsz’s map on the internet. What I did find was a detail image of unknown provenance on the interesting site, Dutch thematic maps on the web.
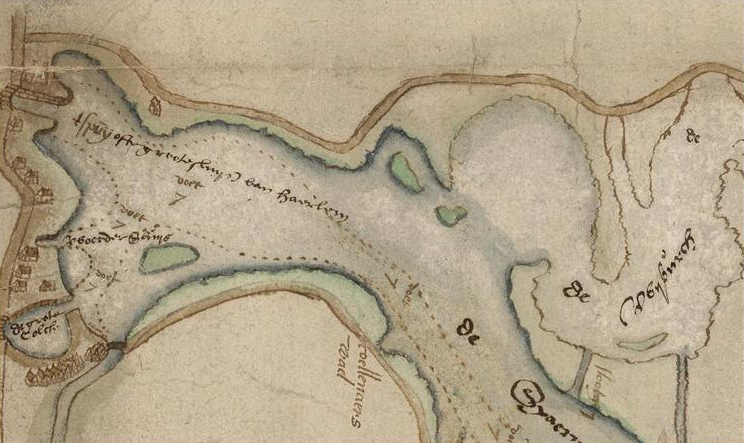
On the above you can clearly see the dashed bathymetric line of equal depth.
choropleth
Frenchman Charles Dupin’s (1826) Carte figurative de l’instruction populaire de la France is the first known choropleth map.
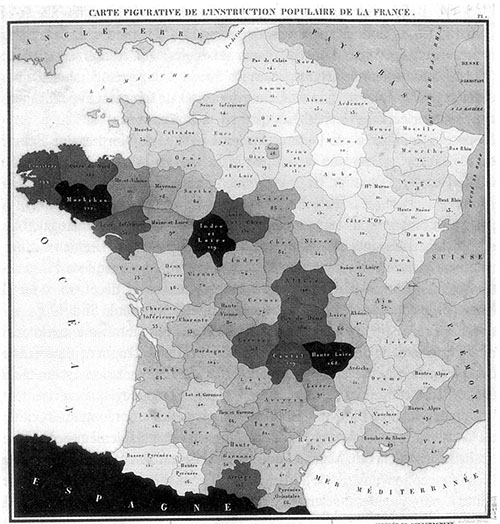
Dupin’s map was and is well known, and had a great impact on cartographers and statisticians at the time. Interestingly, the particular form of Dupin’s choropleth map — the unclassed variety, in which each unique value gets a unique shade — didn’t stick. The classed variety quickly took hold, with the first such map appearing in an 1828 Prussian atlas, Administrativ-Statistischer Atlas vom Preussischen Staatae.
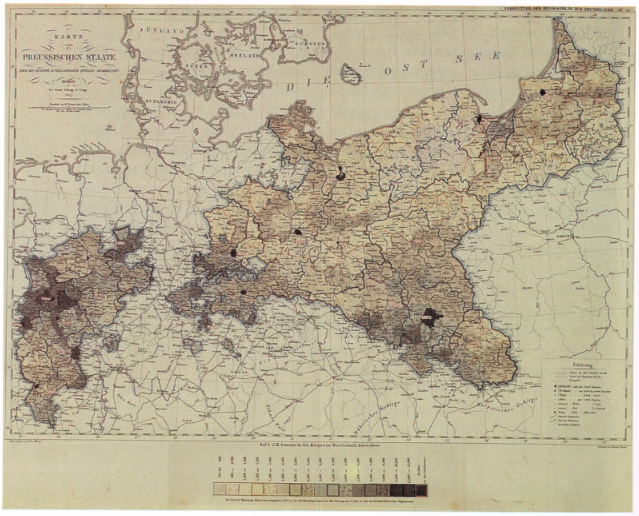
Notice not the subtle lean in my scan (from Robinson since I couldn’t find it elsewhere), but the class breaks shown along the bottom. The author of the thematic portion of the atlas is unknown.
dot density
Dupin’s fellow countryman Frère de Montizon is responsible for the first dot density map, Carte philosophique figurant la population de la France (1830).
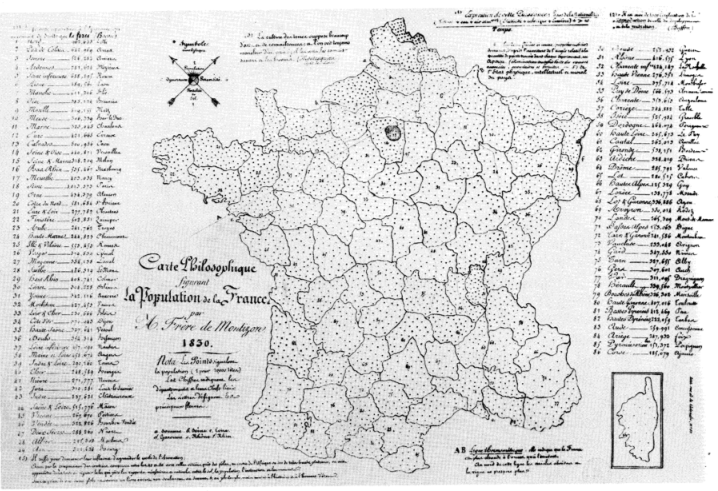
Unlike Dupin, who is fairly well known, Robinson describes Montizon as a “mystery man”. He continues,
It is one of the accidents of history that Frère de Montizon’s invention of the thematic dot map should have gone completely unnoticed. In terms of cartographic innovation it ranks with the isothermal map, yet as far as can be ascertained no reference to him or to his dot map was made by anyone well into the twentieth century…this basically simple, logical idea had to wait some thirty years to be reinvented and much longer than that to become generally known.
The symbology was “reinvented” by Thure Alexander von Mentzer in his 1859 map of population distribution in the Scandinavian peninsula. I can’t find any reproductions of this map anywhere.
proportional symbols
The first known example of a proportional symbol map appeared in the Atlas to Accompany Second Report of the Railway Commissioners, Ireland (1837). Though the atlas was apparently quite innovative with regard to thematic cartography, it went largely unnoticed due to limited distribution.
Here, Henry Drury Harness’s map of Irish population density from the atlas.
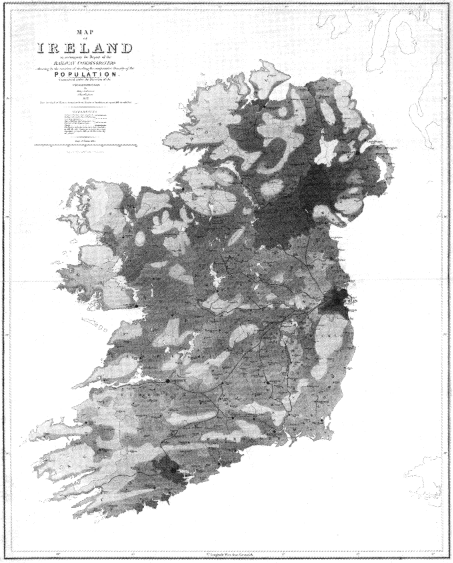
They’re a bit hard to make out in this horrible scan (again from Robinson — listed as part of his personal collection), but there they are: circles scaled according to population centered at various Irish cities. This wasn’t the first time that proportional circles had been used to convey data, but it was the first time it had been done on a map. Notice the shading?- this is also one of the first dasymetric maps.
flow maps
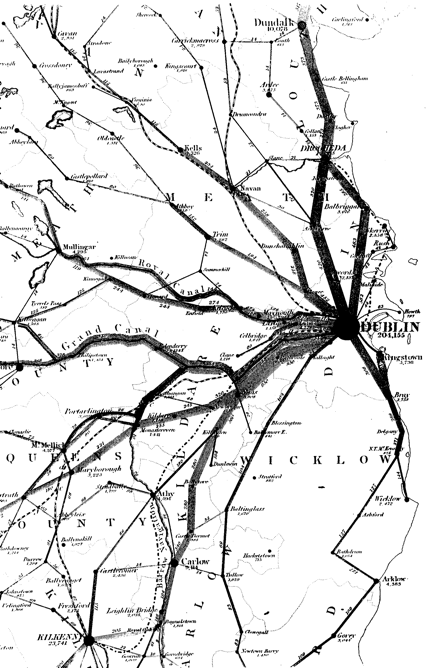
The following map is more well known, and could share the title of first proportional symbol map, as it appeared in the same 1837 atlas as the above map. Here, the innovation is the use of line thickness to convey a quantitative value, in this case the traffic between Irish cities (again by Henry Drury Harness).
cartogram
I’ve written about this before, so below’s a quick summary.
Many sources, including Dent’s text, point to Émile Levasseur as the originator of the value-by-area cartogram. Levasseur included diagrammatic maps like the following 1868 map of Europe in his economic geography textbooks.
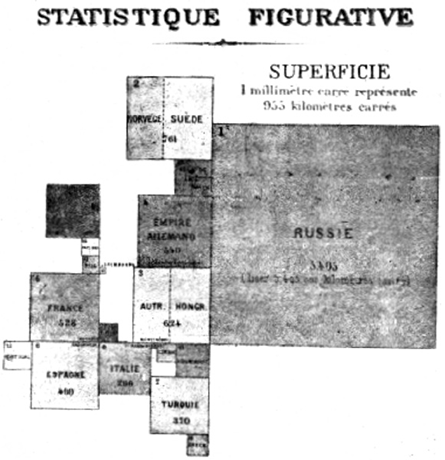
The above map was reprinted by Funkhouser in 1937 and by Waldo Tobler in his Thirty Five Years of Computer Cartograms. In the latter, Tobler notes:
This is a map of the countries of Europe in which each country is represented by a square whose size is proportional to the area of the country, and with countries in their approximately correct position and adjacency. Could this be called an equal area map? Or is it an equal area cartogram?
I believe the former: that this should be considered a diagrammatic equal area map, but not a value-by-area cartogram. Sara Fabrikant makes the case for the German provenance of the first cartogram:
Another notable and early European contribution to the thematic mapper’s toolbox is the value-by-area cartogram. Hermann Haack and H. Wiechel published a cartogram depicting election results from the German Reichstag in 1903 (cited in Eckert 1925).
Haack and Wiechel’s map is indeed cited in Eckert’s famous Die Kartenwissenschaft volumes, but it isn’t reprinted there. Nor is it clear that unit areas on their election maps represented something other than land area. The earliest true value-by-area cartogram that I’ve seen reproduced came by way of Professor John Krygier, who reprinted William Bailey’s 1911 population cartogram.
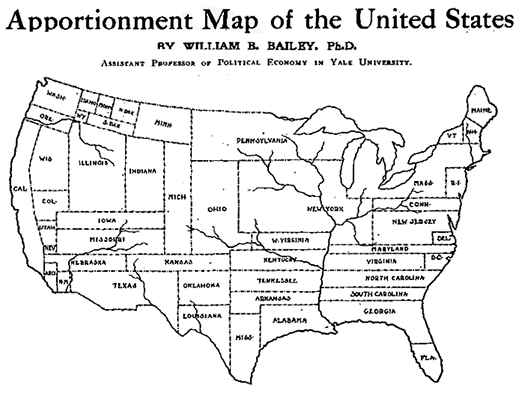
I doubt the above is truly the first cartogram, and welcome any scans or references to true value-by-area cartograms that precede the 1911 map.
conclusion
Four of the six classic thematic cartography symbologies — choropleth, dot density, proportional symbol, and flow — originated between 1826 and 1837. Two of them — proportional symbol and flow — were initially produced by one man (Harness), and appeared in the same obscure railway atlas. All were refined in the 19th century, and only one (isolines) predate the century.
Conspicuously absent above are the names William Playfair and Joseph Minard. Indeed, some sources still cite these well-known engineer-statisticians as the originators of the proportional symbol and flow symbologies. Playfair may have been the first to use proportional (value-by-area) symbols (specifically circles) to represent quantitative data, but it wasn’t on a map.
Funkhouser credited Minard with the invention of the flow symbology, ignoring Harness’s innovation eight years earlier:
The second, called cartograms with bands (cartogramme a bandes), was originated simultaneously and independently by the French engineer, Minard, and the Belgian engineer, Belpaire, in 1845. This consists of colored bands or ribbons which follow the watercourses and railways on a map, the width of the band being proportional to the amount of traffic or number of passengers carried.
It’s certainly the case, though, that Playfair paved the way for much thematic mapping experimentation in the early 19th C. and that Minard helped popularize the flow, proportional symbol, and choropleth symbologies.
11 Comments
Zach,
Nice job. The only one missing perhaps is the dasymetric, about which George McCleary did some fine historical work for his dissertation.
The choropleth was actually not called the choropleth at the time. The name was invented in 1938 by Jack Wright as I’ve written elsewhere (eg., in the Dodge/Kitchin/Perkins book Rethinking Maps.
cheers,
Jeremy
Great job
Where does Dr. John Snow’s 1853 cholera map fit in the time line?
@Tim Carter — John Snow’s map is important b/c of its application area (epidemiology, cholera), not its symbology (a simple dot map, where points represent individual instances). Though this is often touted as the first disease map, it isn’t. According to Milestones, that title goes to Valentine Seaman’s (1798) maps of yellow fever (the image below is from an article on disease mapping on ZevRoss).
Other sources cite the German physician L.L. Finke, who mapped indigenous diseases on a 1792 world map. I can’t find a reproduction of Finke’s work though.
Isn’t it nice to know you know someone that knows a lot about a little.
Thanks for the lesson(s)….
To find the more complete map of Bruinsz, you can check at http://kaarten.library.uu.nl/overkaart.php?lang=en&ItemID=534
ooops missed my web site links
So the access to the map is
http://kaarten.library.uu.nl/overkaart.php?lang=en&ItemID=534
And the browser to navigate details
http://kaarten.library.uu.nl/view/view.php?collection=Thematisch&file=000534&sw=1920&sh=1200
Oh work of art, one of my favourite passions of life becos it give us trues reflection of nature and our environment.
read more…
http://ww.tienshealthshop.com
http://ww.tiensproducts.net
oh, art it tel us how beauty nature and environment is. thanks for sharing.
I want to talk about, great page. I will be uncertain in the event it is often resolved, however when working with Internet explorer I am able to in no way obtain the overall web site to help load without having rejuvenating a lot of times. Might just be the cable box.
Hello, and thank you for this superb posting. I’m currently doing research for a information visualization primer that also has a little bit on the history of different visualization techniques, so I found this very helpful!
I have no training in cartography (I’m a graphic designer by profession), so this might be a completely stupid question, but here goes:
Regarding the earliest proportional symbol maps; aren’t there military maps that use the proportional symbol technique to show the strengths of military units, that are a lot older than the 1837 example here? One I know of is the 1766 map showing British troops in Pennsylvania that can be viewed e.g. at the Library of Congress website (http://www.loc.gov/loc/lcib/0304/papers.html), but I imagine older ones exist, though they were not necessarily made for the public eye. Or am I missing something here?
5 Trackbacks
[...] more: the first thematic maps Tagged as: Cartogram, Cartography, Dot Density, mapping, Thematic [...]
[...] that end, Zach of indiemaps has a fine roundup of the very first thematic maps. The first known choropleth map? That would be Charles Dupin’s [...]
[...] כל כך מגניב: המפות התמטיות הראשונות בעולם. ולא, אין לי מושג מה זה [...]
[...] We started with charts, so we’ll end with maps. [...]
[...] Forest Johnson at indiemaps.com.blog where posts include scans from books and other resources. This example from Johnson reviews the history of thematic [...]