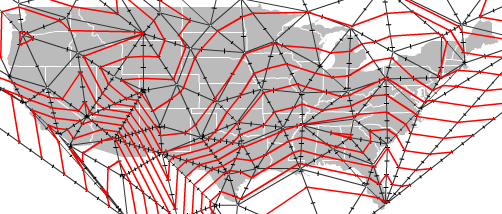
A week or so back I wrote about a package I ported/modified to create the Delaunay triangulation in Flash with a few AS3 classes. As I noted there, such a triangulated irregular network (TIN) allows us to interpolate isolines — lines of constant value (aka isarithms, commonly called contours).
So, given a field of points (weather stations, say)…
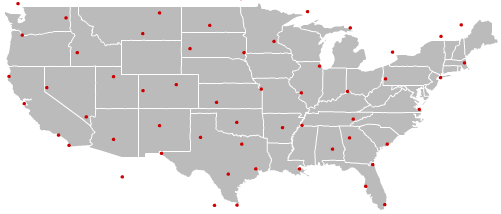
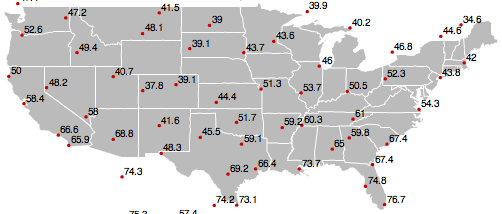
…with one or more attributes attached (temperature, say)…
…a TIN can be constructed.
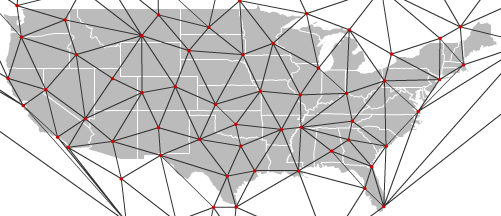
With the above TIN, values can be interpolated along each edge between the points of known values (control points). The interpolation is strictly linear (that is, the value 50 would be interpolated halfway along an edge whose control points were valued 48 and 52).
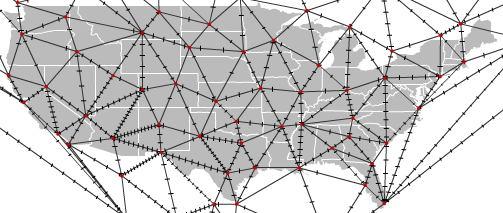
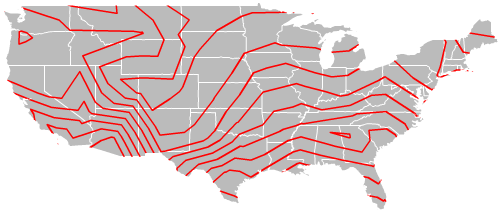
With a given contouring interval (I’m using 4 degrees F here), we can connect some of these interpolated points, creating our contour lines.
With the previous steps stripped away, this creates a passable isoline map.
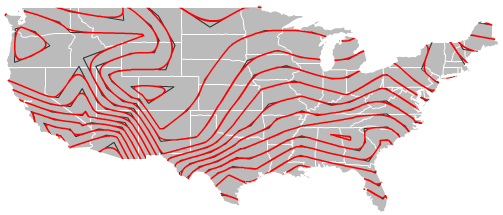
The lines are rigid, though, and should be smoothed for presentation. I allow two methods for this. You can use the “simple” method, which just uses the built-in graphics method curveTo between the midpoint of each isoline segment (below with the isoline interval decreased to 3 degrees).
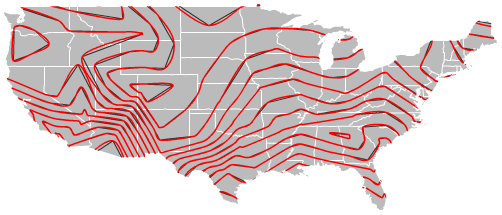
The above looks alright, but the curves are not continuous, closed loops can still have hard corners, and the isolines no longer pass through the interpolated points (we have therefore generalized an already-inaccurate interpolation). My compatriot Andy Woodruff, author of the glorious new Cartogrammar blog, offered to write a nice continuous curve method that ensured isolines would still pass through the interpolated values. You can read about the method in his post. Here she blows:
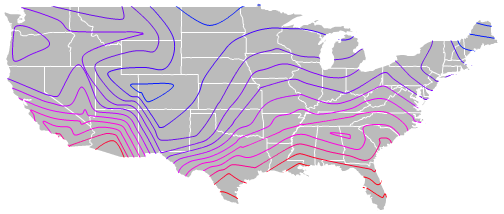
Bringing it all together, then, and incorporating the only extra feature I wrote (tinting of isolines), here’s a nice finished isoline map of temperature across the U.S.
My new isolining package for Flash/ActionScript3 accomplishes all of the above, requiring only an array of point data with attribute values attached. The above example, was accomplished with the following lines of code (after drawing the U.S. states from a shapefile).
var triangles:Array = Delaunay.triangulate(points);
Delaunay.drawDelaunay(triangles, points, triClip, false); //comment this out if you don't want to draw the triangulation
//generate an array of isolines (isoline objects)
var isos:Array = IsoUtils.isoline(triangles, points, triClip, 3, 0);
//create color and class arrays for tinting the isolines
var classesArray:Array = new Array(40, 44, 48, 52, 56, 60, 64, 68, 72, 76);
var colorsArray:Array = new Array(0x051CFD, 0x4602FD, 0x6D0EEB, 0x8400FF, 0xC400FF, 0xEA00FF, 0xFF00E2, 0xFF0095, 0xFF0030, 0xFF0015, 0xFB3507);
//then, actually draw them, using a continuous curve
IsoUtils.drawIsolines(isos, triClip, "continuous", colorsArray, classesArray, .5, .95);
The full example is included in the .zip distribution. Get that here:
- the full .zip thing (in addition to my isolines class and an example, the archive includes my delaunay triangulation package, Andy Woodruff’s cubicBezier class, and a slightly modded version of Edvin van Rijkom’s shp classes, which are used to draw the shapefile in the example .fla)
- or, for you browsers, the main IsoUtils.as class
Keep in mind: triangulation is just one interpolation method, and is many ways the least technical (and accurate). More accurate interpolation techniques include inverse-distance and kriging. ***If you’re having trouble, and your isoline interval is not an integer, check out the comment at line 171 of isoUtils.as. Please fix that, BTW.
I meant to add other features, but since I started work this past week, I’m posting the package as-is, and invite others to modify. On my wishlist:
- hypsometric tinting, or color between the lines, would allow for more effective terrain or temperature mapping
- support for projections and other coordinate conversions in the drawIsolines method. I have packages for converting lat/long to a number of map projections, but currently the drawIsolines method doesn’t have support for passing a point coordinate conversion method.
- an animated demo. This thing’s lightning-fast, so why not?
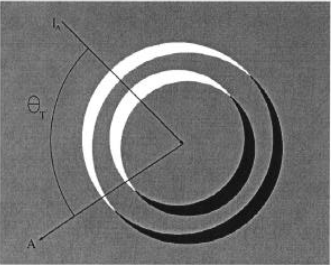
- something that would be super wicked would be if someone would implement Tanaka’s illuminated contours [pdf] method, that thickens/thins and darkens/lightens lines like so…
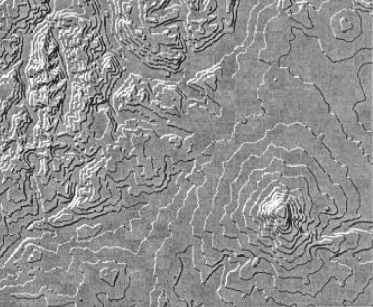
…creating beautiful relief maps like the one below
If you add anything to the package, feel free to post a link to your revised version in the comments.
30 Comments
Great stuff, thanks for taking the time to explain it as well as post it!
Illuminated contours look lovely, I wonder if a passable version of them could be achieved with a BevelFilter?
AMAZING!
ur api for contour is wonderful
and thanks a lot to u
i’d like to fill color between lines ,and want it bo be like
http://blog.spatialkey.com/images/sacbee1.png
how can i extend ur api?
can u give me some hint?
thanks a lot!
this letter woman frog
The New Dress summary and study guide, with notes, essays, quotes, and pictures.
Get the latest mobile phones online at Dialaphone, the mobile phone shop offering great deals on the latest mobile phones.
Hey, this is awesome… well done!!
However for some reason the isolines mess up when the nodes/weather stations are square.
It would be great if you could fix this.
Raymond
This looks interesting. Iwas hoping to apply this to archaeological site densities…but not being all that computer savy I am not able to open the application files after unzipping. A little help please.
@erik: Hello, this is a small library specifically for Flash, Flex, or ActionScript 3 projects. So if you want to display your data as an isoline on the web, it may be for you. But if you have no use for an ActionScript-specific solution, other options may be better for your needs. R & GRASS, for example, are free tools with lots of flexibility in contouring. Neither are very easy to get started with, but both would be easier to use (esp. importing your data) than my classes if you don’t need a Flash solution
nice work you’ve done, congratulations! In our office we would like to generate our charts and diagramms esp. contour-maps with flash for interactive presentations. I’ve searched the web the last year and havn’t found the right stuff. I will try out your software, you are on the right way! The next weeks, I will also take a close look on alternative implementations for GIS-interpolations. For example: http://www.geog.ubc.ca/courses/geog470/notes/interpolation/interpolation.html
when we can push your software into this… it would be a great deal! Thanx for your posting
Kind regards
Moritz
Not that I’m impressed a lot, but this is a lot more than I expected when I found a link on Delicious telling that the info here is quite decent. Thanks.
система ниппель: туда суй - оттуда х#й
Петербуржская Школа Правильного Питания (7 минут от метро “Чернышевская”) приглашает всех желающих избавиться от лишнего веса на бесплатные вечерние (18:45) ознакомительные занятия 15, 16, 18, 19 и 22 июня 2009г.
Более подробная информация и запись на сайте - http://hudeem-vmeste.com
I have been looking for something like this for ages! It looks great.
I just opened it up and I keep getting 8 of these compiler errors:
Warning: 3596: Duplicate variable definition.
能给我一点资料吗?
Very impressive !. Congratulations and keep working as you do, your work is very useful !.
Hello All.
I the first day here.
It is assured to you it will be pleasant,news Blog
http://keeley-hazellsex-tape.blogspot.com
well done! Your AS Libarary is most valuable.
I think that if you give some examples such as organization of variable ‘points’ ,’triClip’, it will be easier to understand. However, your work is done very well, thanks for your share!
Very nice your implementation for AS. Do you know something like this for PHP or JS?
Thanks in advance
Aw, this was a very nice post. Finding the time and actual effort to create a very
good article… but what can I say… I hesitate a lot and never seem to get nearly anything done.
i want to know where to add the inputs. I am quite a noob in this matter.
Hi there, I found your website by means of Google even as looking for a comparable subject, your site got here up,
it appears great. I have bookmarked it in my google bookmarks.
Hi there, just turned into aware of your weblog through
Google, and located that it is really informative. I am going to
watch out for brussels. I will be grateful in the event you continue this in future.
Numerous other people will probably be benefited from your writing.
Cheers!
Asking questions are genuinely fastidious thing if you are
not understanding anything fully, however this post offers nice understanding yet.
Hey there! I simply wosh to offer you a huge tyumbs
up for the excellent info youu have got right here
on this post. I will be coming back to your web
site for more soon.
I am really glad to read this webpage posts which consists oof tons of useful facts,
thanks for providing such information.
have you finished “hypsometric tinting”?
@zach’ry:Hello,have you finished “hypsometric tinting”?
@zach’ry:Hello,have you finished doing “hypsometric tinting”?
Jе suis entièrement en accord avec toi
8 Trackbacks
[...] isolining package for ActionScript 3 You can use the “simple” method, which just uses the built-in graphics method curveTo between the midpoint of each isoline segment (below with the isoline interval decreased to 3 degrees). The above looks alright, but the curves are not … [...]
[...] update: for a cool usage of Delaunay triangulation, see my isolining package for ActionScript 3 [...]
[...] specially aggregated data-structure into isoLines input Posted: February 15th, 2011 Categories: OOP Tags: Comments: No Comments. Write a comment [...]
[...] your browser interpolate isolines is fun! I first did these in ActionScript 3 back in 2008. This JavaScript version works essentially the same way: generating a triangulated irregular [...]
[...] uses these triangulations in his map-making, you’ve gotta check out the sequence of images on this page. It’s incredible how just a scattering of local temperature measurements can be extended to [...]
[...] 原文:isolining package for ActionScript 3 [...]
[...] as版等值线 http://indiemaps.com/blog/2008/06/isolining-package-for-actionscript-3/ geoserver拓展的等值线 [...]
[...] colorful contour lines that arise from the differential equation governing heat flow. The temperature maps by Zachary Forest Johnson from a few weeks ago also used contour lines. And I found some great [...]