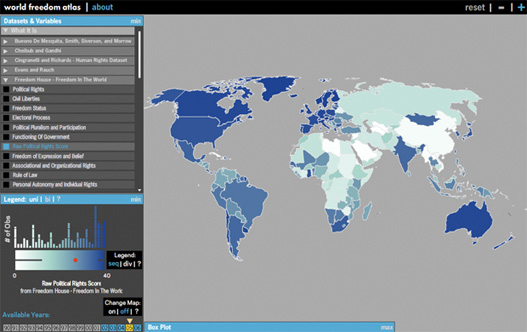
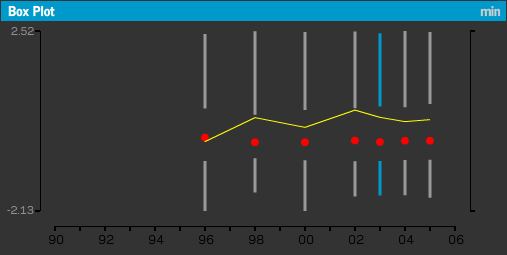
The World Freedom Atlas is a geovisualization tool for world statistics. It was designed for social scientists, journalists, NGO/IGO workers, and others who wish to have a better understanding of issues of freedom, democracy, human rights, and good governance. It covers the years 1990 to 2006. It began as a final project for Professor Mark Harrower’s Geography 575: Animated and Web-based Mapping. I was joined in the early stages by Richard Donohue, Matthew Purdy, and Colleene Thomas, though I took over the project and finished it on my own over the summer. I also owe a big thanks to Andy Woodruff for his help throughout the project.
I was inspired in the early stages of this project by GapMinder World and the World Bank Online Atlas of the Millennium Development Goals. I believe my atlas complements these efforts and extends their approach. The atlas was programmed entirely in Flash 8/Actionscript 2.0 (with a tiny bit of PHP — w/ AMFPHP – to retrieve data from a mySQL database). The data are mostly from the huge Quality of Governance Institute dataset.
The project began in April of 2007 and ended just this month. I’ve been fortunate enough to get a lot of attention from the blogosphere, and have received over 30,000 unique hits as of today. There are dozens of things I’d like to add, change, or improve. Unfortunately I haven’t the time at this point. Please shoot me an email (zach.f.johnson[at]gmail.com), though, if you have any questions, concerns, ideas, issues, etc. about the map.

