Welcome to the portfolio of cartographer Zachary Forest Johnson. I make web maps and information visualizations.
portfolio: code | interactive | print
Code
shpUtils.py | easy shapefile loading module for Python
produced Jan-Feb, 2008 | in Python | originally produced for my work-in-progress cartogram algorithm | loads data from shapefiles and accompanying dBase attribute file | includes some helpful functions for getting true centroids, polygon area, overlap, etc. | source | more | even more

time-series-graph | Google Finance-esque Charting Class for Flash/AS3
produced late summer 2007 | designed for Flash/AS3, but shouldn't be too hard to use in Flex | originally designed for use in the Hydrologic Dashboard | can accept any temporal data | for use examples, see the following blog entries: introducing time-series-graph | TimeSeriesGraph: Now with Flags!! | see my time-series-graph page on Google Code
Interactive
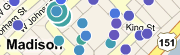
asthMap | A Visualization Tool for Mapping Asthma Exacerbations
started Summer 2007, still in production | in Flash/AS3 with AMFPHP/mySQL | w/ Andy Woodruff | early collaboration with Eve McGlynn and Robert Roth | client: David Van Sickle, a postdoc fellow in the Department of Population Health Sciences, UW | early version with fake data | more
hydrologicDashboard | UW Sea Grant visualization/dashboard
started late Summer 2007, still in production | in Flash/AS3 | w/ Andy Woodruff | client: David Hart, UW Sea Grant | uses my time-series-graph classes | latest version | more

World Freedom Atlas | A Visualization Tool for Social Scientists
started April 2007, completed September 2007 | in Flash/AS2 | early help from Andy Woodruff, Richard Donohue, Matt Purdy, and Colleene Thomas | won the David Woodward Award for the Best Electronic Map in the ACSM/CaGIS Annual Map Design Competition, Student division, 2007 | runner up in the NACIS Student Web Mapping Competition, 2007 | to the map | more | even more | more more more

streamViz | early version of hydrologicDashboard
produced march/april 2007 | in Flash/AS2 | lab 3 for Mark Harrower's Geography 575 | to the map | more
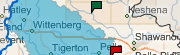
wiscMapper | nice, flexible wisconsin county data visualizer
produced feb/march 2007 | in Flash/AS2 | won the Barbara Bartz Petchenik Award for Cartographic Design, UW Geography | started as lab 2 for Mark Harrower's Geography 575 | to the map | more

flightMap | my first flash map!
produced jan/feb 2007 | in Flash/AS2 | lab 1 for Mark Harrower's Geography 575 | to the map | more

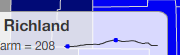
Armed Forces Cartogram | pdf
produced nov/dec 2007 | in Illustrator | won the 2007 National Geographic Mapping Award | Final Project for Mark Harrower's Geography 572 | pdf link
Relief-shaded map of Sweden | png
produced october 2007 | in Illustrator/Photoshop | the 24-hour lab for Mark Harrower's Geography 572 | png link

Madison's Treasures | pdf
produced october 2007 | in Illustrator | lab 2 for Mark Harrower's Geography 572 | pdf link
New Orleans Golf Courses | pdf
produced september 2007 | in Illustrator | lab 1 for Mark Harrower's Geography 572 | pdf link
New Zealand Sheep | pdf
produced october 2005 | in arcMap and Illustrator | lab 4 for Mark Harrower's Geography 370 | pdf link

Canadian Minorities | pdf
produced november 2005 | in arcMap and Illustrator | lab 5 for Mark Harrower's Geography 370 | pdf link

Badger Football Recruiting | pdf
produced nov/dec 2005 | in Illustrator | final project for Mark Harrower's Geography 370 | pdf link

